[ad_1]
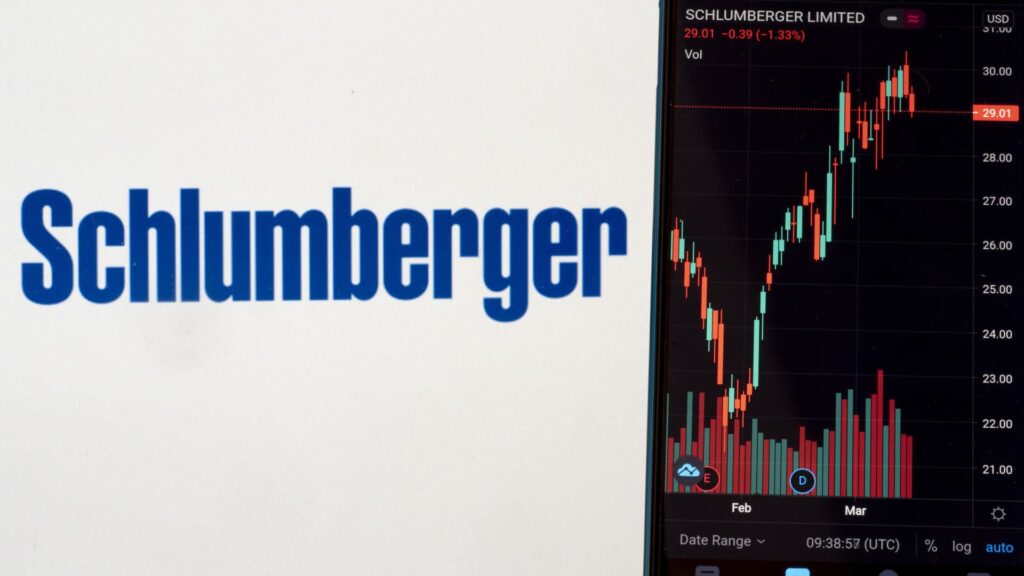
Energy companies have always held a special place for me because one of the first products I traded when I first entered the business in the mid-1990s was options on the Philadelphia Oil Services Index and its associated constituents. Some of the names in the index have changed since then, but Schlumberger remains the largest. A leading oilfield services company, Schlumberger faces a complex landscape in 2025. Ultimately, its economic fortunes rise and fall with the tide of oil prices. Lately, that tide has been going out. Despite tariff uncertainties, the International Energy Agency sees global oil demand growing modestly by 1.2%, fueled by non-OECD markets such as China and India. SLB’s diversified portfolio — spanning drilling, production, and digital solutions — captures this growth, with 60% of revenue coming from international markets that are less exposed to U.S. housing weakness. Its digital transformation, including the DELFI platform, enhances efficiency, boosting margins (Q1 2025 adjusted EBITDA margin: 25.3%, up 120 bps YoY). Strategic partnerships, like the $7.8 billion ADNOC contract, secure long-term revenue in high-margin Middle East markets. Financially, SLB’s Q1 2025 results outperformed. Management raised 2025 guidance, projecting 15% revenue growth and EPS of $3.50, implying a forward P/E of 13, which is below that of peers like Halliburton. SLB’s $3 billion share buyback and 2.3% dividend yield enhance shareholder value, supported by $1.2 billion in free cash flow. Tariffs (on equipment imports, for example) should be manageable, as SLB’s global supply chain and localized production mitigate costs. A potential Federal Reserve rate cut (39 bps priced for 2025) could ease debt costs. Geopolitical tensions (e.g., OPEC+ cuts) create some support for oil prices, which in turn would support upstream investment. Technicals are mostly bullish, with eight of the top 10 best-performing indicators, including the Commodity Channel Index, flashing buy signals. That said, the longer-term trend since mid-2023 has been lower, and the stock has not meaningfully broken above the 150-day moving average since Q4 that year. So, what explains the weakness? Global oil demand growth is slow. Energy transition pressures curbing upstream investment. U.S. shale activity, 20% of SLB’s revenue, is stagnating, with rig counts down 5% YoY (Baker Hughes, June 2025) Oil price volatility, along with geopolitical risks such as potential OPEC+ oversupply or a U.S.-China trade escalation, could push oil prices lower. Concerns about the Strait of Hormuz, which caused a brief spike in oil prices, have since been reversed as observers have determined that Iran would only harm itself if it threatened that vital oil shipping lane. Schlumberger will be reporting earnings on July 18. The average of sell-side analyst estimates is for adjusted EPS of 74 cents per share on revenue of $ 8.518 billion, down 11.6% and more than 6%, respectively, from the prior year. That said, valuation multiples are near their lowest levels on record, approaching numbers only seen previously during market crashes like the pandemic and the great financial crisis. I don’t usually encourage trying to “catch the falling knife,” but the stock has stabilized off the April lows. One way to take advantage of a basing situation, if that’s what this is, would be to sell some puts. If the stock continues sideways or rallies one keeps the premium (and can potentially reload). Worst case one would own the stock at a discount, not far above the April lows. Here’s the trade: Sell 1 Aug. 15 $35 put DISCLOSURES: None. All opinions expressed by the CNBC Pro contributors are solely their opinions and do not reflect the opinions of CNBC, NBC UNIVERSAL, their parent company or affiliates, and may have been previously disseminated by them on television, radio, internet or another medium. THE ABOVE CONTENT IS SUBJECT TO OUR TERMS AND CONDITIONS AND PRIVACY POLICY . THIS CONTENT IS PROVIDED FOR INFORMATIONAL PURPOSES ONLY AND DOES NOT CONSITUTE FINANCIAL, INVESTMENT, TAX OR LEGAL ADVICE OR A RECOMMENDATION TO BUY ANY SECURITY OR OTHER FINANCIAL ASSET. THE CONTENT IS GENERAL IN NATURE AND DOES NOT REFLECT ANY INDIVIDUAL’S UNIQUE PERSONAL CIRCUMSTANCES. THE ABOVE CONTENT MIGHT NOT BE SUITABLE FOR YOUR PARTICULAR CIRCUMSTANCES. BEFORE MAKING ANY FINANCIAL DECISIONS, YOU SHOULD STRONGLY CONSIDER SEEKING ADVICE FROM YOUR OWN FINANCIAL OR INVESTMENT ADVISOR. Click here for the full disclaimer.
[ad_2]
Source link

